Coastal flood mapping for South Australia
Significant coastal storm events and the ongoing impacts of climate change have highlighted the urgent need for detailed, actionable information to identify areas vulnerable to coastal flooding. These insights are crucial for prioritising adaptation strategies and effectively managing our coastline.
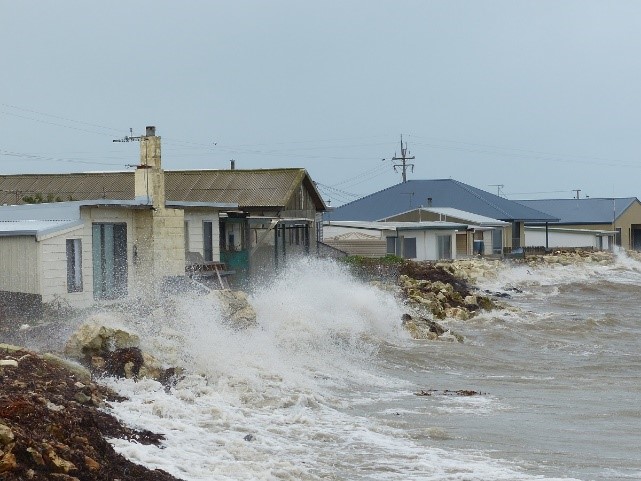
Climate change is expected to increase the frequency, intensity and impacts of some weather events, such as coastal storms. Sea level rise leads to increased frequency and depth of flooding in coastal areas. That’s why it’s important to identify areas that are likely to be affected by storm events to determine the most appropriate management strategies, such as avoid, retreat, accommodate or do nothing.
Developed through a partnership between local government associations, the Coast Protection Board, and the Department for Environment and Water and Landscape Boards, this tool has been expanded to cover most of the South Australian coastline. It pinpoints areas at risk due to storm surges and sea-level rise, differentiating between areas with direct coastal connections and those potentially impacted by future landform change.
There is however currently no coastal flood mapping for the area west of Fowlers Bay or between Victor Harbour and Kingston SE. The coastal flood hazard for the Port Adelaide area is currently being investigated through a separate project using a different model and will be added in the future.
The coastal flood maps aim to:
- identify areas that may be vulnerable to coastal flooding at a regional scale
- visualise the potential impacts from different sea level rise scenarios
- differentiate between areas that are connected to the coast and those with no current flow path to the coast but that could be at risk of coastal flooding with landform changes such as erosion or earthworks
- inform policy-making and strengthen partnerships in managing coastal hazards.
Spring high tide water level

Storm surge water level
×![]()
What is bathtub modelling?
This identifies any land below a certain elevation as being at risk of flooding, like pouring water into a bathtub. Bathtub flood modelling is a relatively quick and effective method of identifying potential risk at a large or regional scale. There are several limitations with this methodology which are identified below. For a detailed understanding at a local level a more comprehensive assessment is required to determine the local scale implications and inform management decisions.
The coastal flood mapping has limitations which users need to be aware of, including:
- No allowances for future changes to the landform, through uplifting or movement of tectonic plates or through the installation of man-made structures since the original data were captured.
- No consideration for hydraulic flow restrictions, such as the width and depth of channel flow paths for flooding (i.e., can enough sea water flow through a restriction to fill the low-lying area during the duration of the storm surge event).
- No consideration of coastal erosion hazard.
- No allowance for wave run-up.
- No coverage of inland coastal areas beyond the extent captured by the LiDAR, so any land further in-land will not show in the scenarios.
- No allowance for coincident flood risk from inland (e.g., rainfall or river) sources.
These limitations may result in an over-estimation of flood risk in some areas and an under-estimation of flood risk in other areas. Users will need to undertake further investigation or planning including: the assessment of protection measures and land use zoning or detailed hydrodynamic modelling using local data to inform decision making.
These maps are for planning, awareness, and educational purposes only and should not be used for site-specific analysis. For information on riverine and stormwater flood risk please refer to the Flood Awareness Map on the Water Connect website.